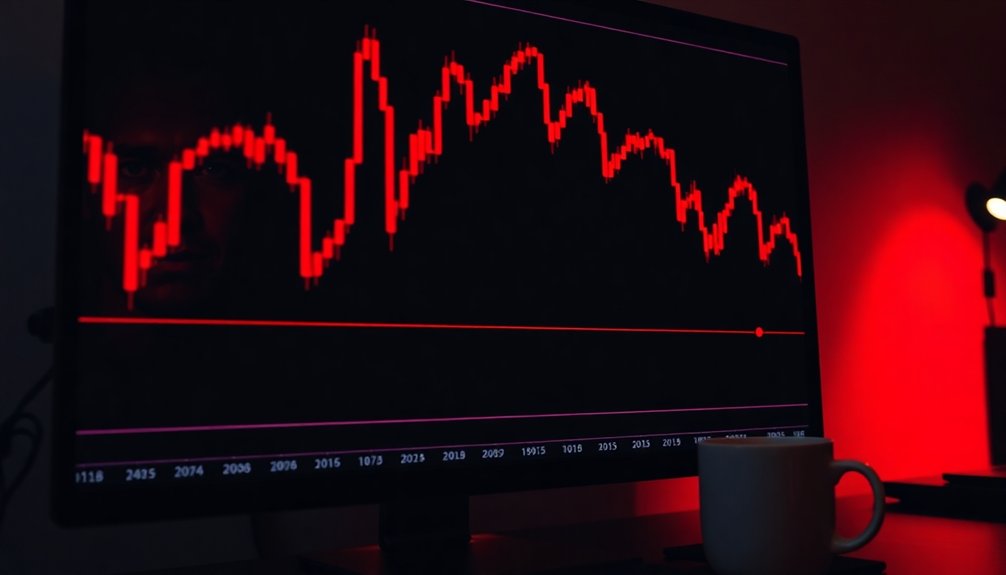

Traders beware. Bitcoin has completed a textbook bear flag breakdown, sending shockwaves through crypto markets while the US Dollar Index (DXY) simultaneously plummets to multi-year lows. The pattern emerged following last month’s steep price decline, with BTC dropping 22% in just four days—a classic flagpole formation that caught many bulls off guard. Yeah, those diamond hands aren’t looking so shiny now.
Market’s verdict is in: Bitcoin’s bear flag confirms the party’s over, while diamond hands turn to dust.
The consolidation phase lasted nearly two weeks, forming a narrow upward-tilting channel that gave false hope to optimistic investors. But markets don’t care about hope. The breakdown confirmation came yesterday when Bitcoin sliced through the lower boundary of the flag pattern on 43% higher-than-average volume—a critical technical signal that validates the pattern’s bearish implications.
What makes this breakdown particularly significant is its textbook execution. The initial flagpole showed massive selling pressure with volume spikes. Then came the flag: that deceptive period of sideways movement where Bitcoin barely retraced 38% of the flagpole’s length, staying well below the 50-period moving average throughout consolidation. Classic stuff.
Technical analysts are now projecting price targets based on the flagpole’s height, suggesting potential downside of another 18-22%. This profit target calculation follows standard bear flag methodology, where the height of the initial drop is projected downward from the breakdown point. Not exactly what HODLers wanted to hear. The breakdown coincided with DXY hitting multi-year lows—a correlation that historically should support Bitcoin prices. The fact that it didn’t speaks volumes.
False breakdowns do happen. The market loves to fake out traders. But this one shows all the hallmarks of the real deal: high volume, follow-through movement, and continued resistance at the 50-period MA. The pre-flag RSI readings dipped below 30, providing strong confirmation of the established downtrend condition before the pattern fully formed.
What’s brewing next? The pattern suggests continued downward pressure. The last three bear flag completions in Bitcoin led to extended declines averaging 31%. These market conditions highlight why day traders with advanced risk management skills may navigate this volatility better than passive HODLers.
Still, anything can happen in crypto. Some contrarians point to the DXY weakness as potential fuel for an eventual reversal. For now though, the bears are firmly in control.